roadtint.
Turn traffic-map screenshots into congestion numbers you can compare.
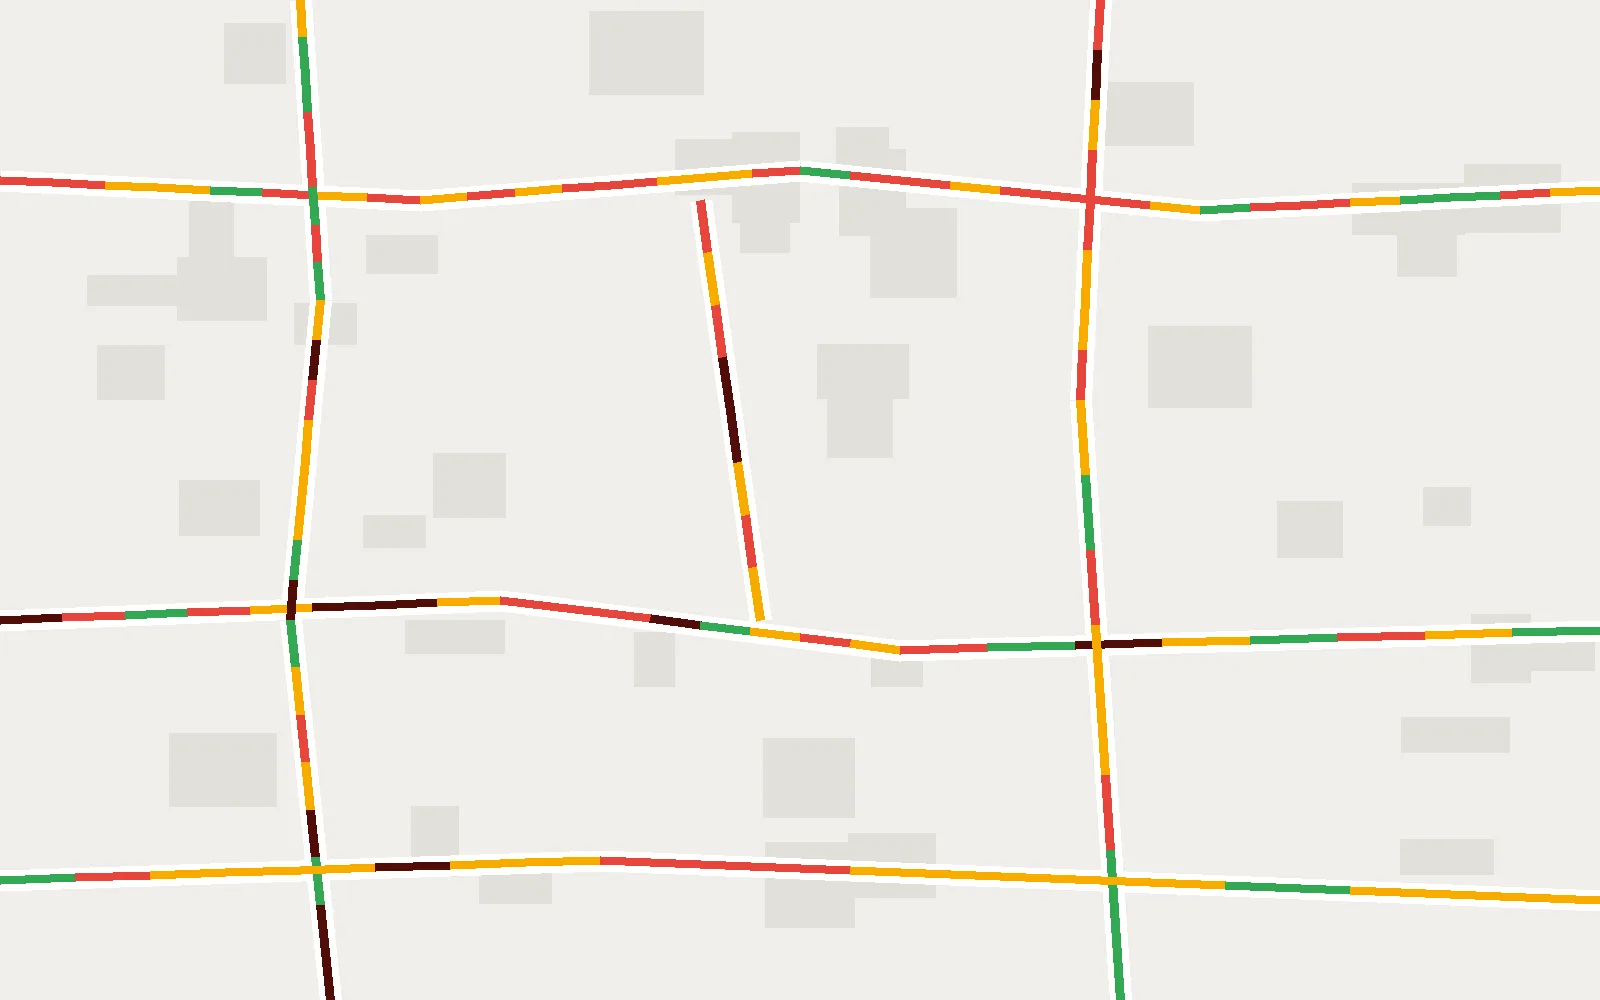
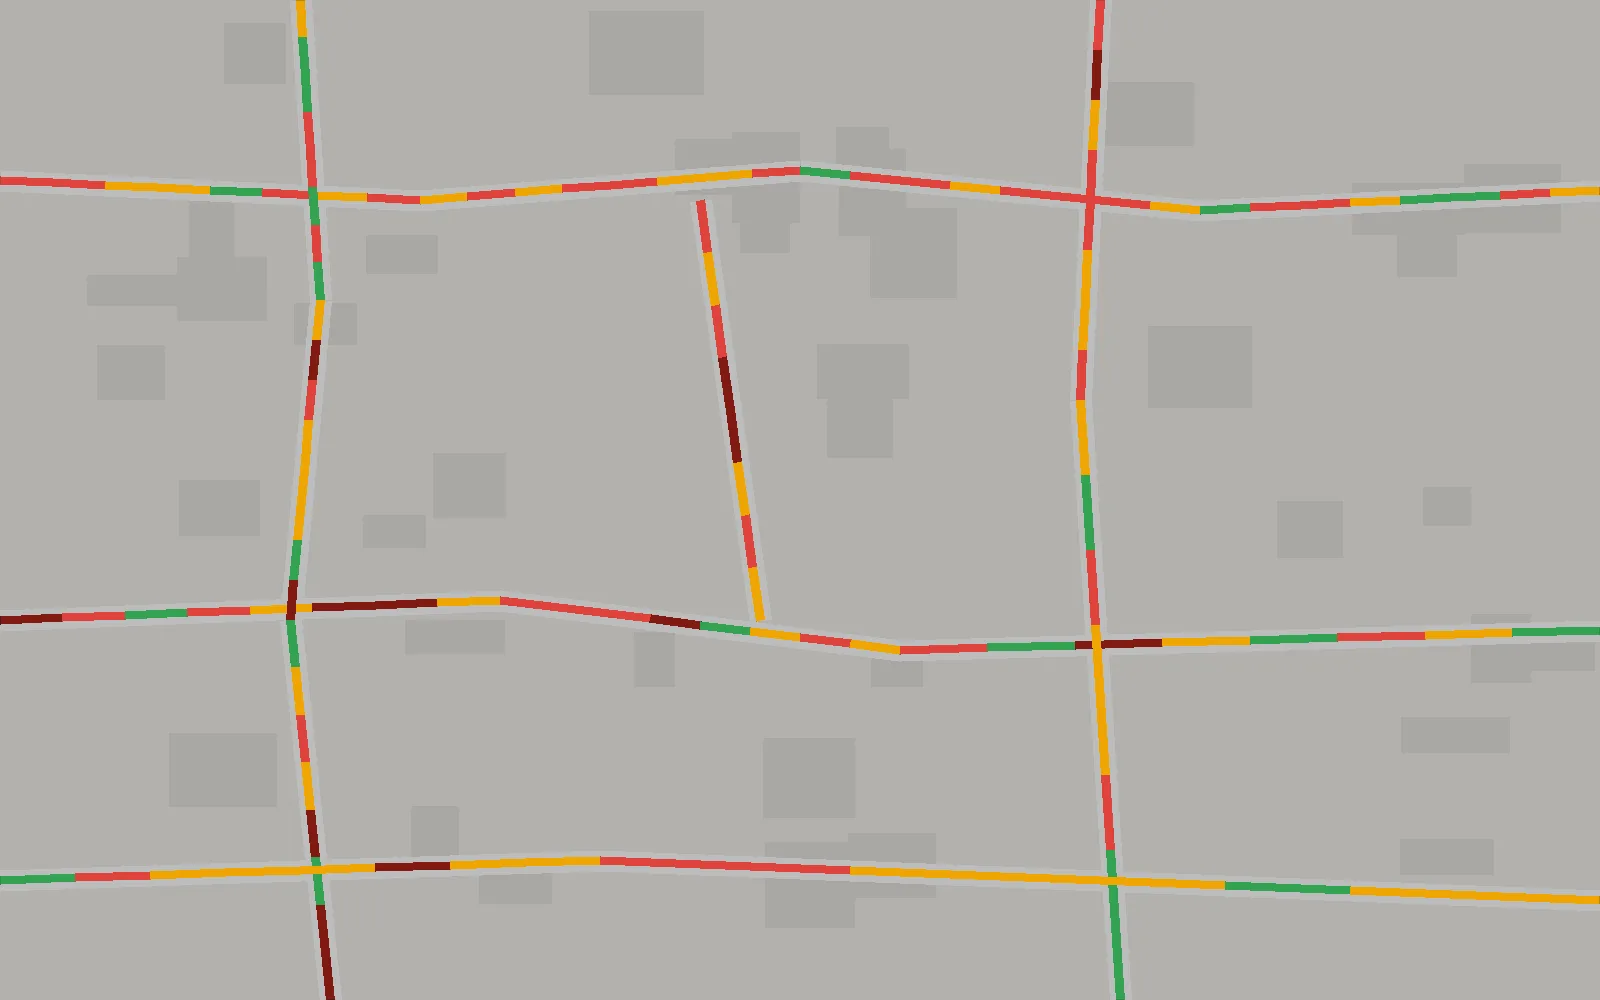
Lots of traffic data is locked up in pictures: a map service with no API in your region, an archived screenshot, a recording of a traffic dashboard. The colour is right there on the road. The hard part is turning it into a number that means the same thing in two different frames.
roadtint does that. Point it at screenshots, exported tiles or a screen recording of a traffic layer, and it tells you what share of the visible road is free-flowing, slow, congested or blocked, as CSV or JSON. It runs entirely on your machine.
Sample run
A real day of captures from one junction in Islamabad, half-hourly from 08:00 to 17:00 (output trimmed):
$ roadtint series ./islamabad-f8
08:00       0.182  #######
09:30       0.123  #####
13:00       0.255  ##########
14:30       0.352  ##############
17:00       0.171  #######

16 frames (4 duplicate(s) dropped)  mean=0.196  peak=0.352 at 14:30
The index weights each class (free 0, slow 0.5, congested 1, blocked 1.5) by its share of the road. The gallery shows a synthetic test frame and the overlay roadtint draws of what it matched, so you can check a profile by eye.
Why the numbers are comparable
- Shares, not counts. Each class is a share of the road detected in that frame, so zoom and crop don’t change the answer.
- Length, not area. Roads are thinned to a one-pixel centre line first, so a wide motorway doesn’t outweigh an equally long side street.
- Duplicates removed. Repeated frames quietly flatten a time series.
seriesdrops them by default.
What it does
roadtint extractmeasures one image or a folder, with optional overlays.roadtint seriesbuilds a time series, reading times from filenames like08_00am.pngor1430.png.roadtint dedupfinds repeated frames.roadtint calibratelists the dominant colours in your image and builds a profile for any map style. Google Maps, Mapbox and HERE are bundled.- Video input and charts are optional extras.
Install
pip install git+https://github.com/hassixmalik/roadtint.git
roadtint extract ./captures
Core needs only numpy, pillow and pyyaml. Add [video] for recordings or [plot] for charts.
Built with
Python 3.9+, NumPy and Pillow. MIT licensed. It grew out of a 2023 university lab notebook.
Changelog
v0.1.0First release: extract, series, dedup, calibrate and overlays, with Google Maps, Mapbox and HERE profiles. · 2026-11-12